How to plot the MATLAB graph for the given equation in MATLAB?
Example of Plotting MATLAB Graphs
Now let’s take different examples to plot MATLAB graphs based on various mathematical functions.
Problem 1: How to plot the MATLAB graph for the given equation in MATLAB?
y=(xˆ2+12x+24)

for the value of x between 0 to 12.
Solution:
In the given equation, the range of the ‘x’ is 0 to 12. And there will be ‘y’ value corresponding to each x value in that range.
x=(0:1:12)  or  x =(0,1,12)

and

 y=(x^2+12*x+24)
MATLAB code for the given mathematical function:
Here is a simple code in MATLAB, to draw the graph for the given equation.

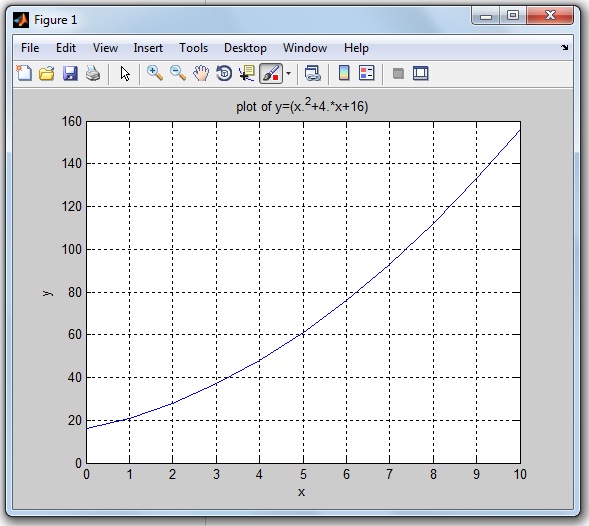
Output in MATLAB:
When you run the program, you will get a MATLAB graph along with the grid display.