
Problem 2: How to plot a Sin Function in MATLAB?
The function of y(x)= Sin(x)

for 0<x<10
Solution:
The range of the x is 0 to 10.
Here, I am considering a 0.1 difference between the range of X (0 to 10). Due to this minimum point difference, you can get a smooth sinusoidal wave.
x = (0:0.1:10) or x=(0,0.1,10)

and

y = sin(x)
The less you have a difference, the smoother you will get the graph.
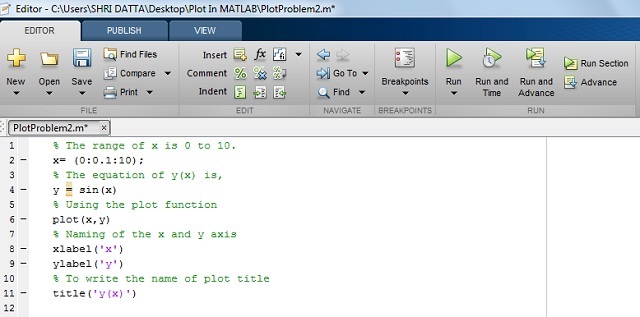
MATLAB code for Sin function:
Write the MATLAB code for the function of y(x) as below.
Output in MATLAB:
After running the program, you will get the sin wave graph.
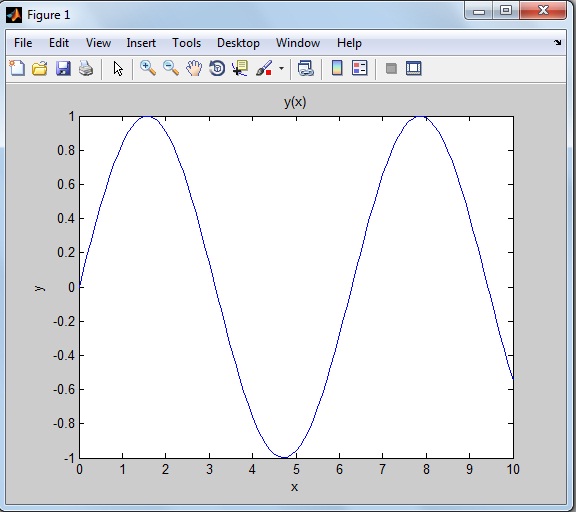
The above sinusoidal figure is drawn without the function of the grid (i.e. grid off function).
Similarly, you can plot the graph for other trigonometric functions like cos, tan, cosec, cot, sec…