
How to plot the Trigonometric Function in MATLAB?
Let’s take an example of any trigonometric function.
y(x) = (10 cos(x) sin(x))

For the range of x is 1 to 100
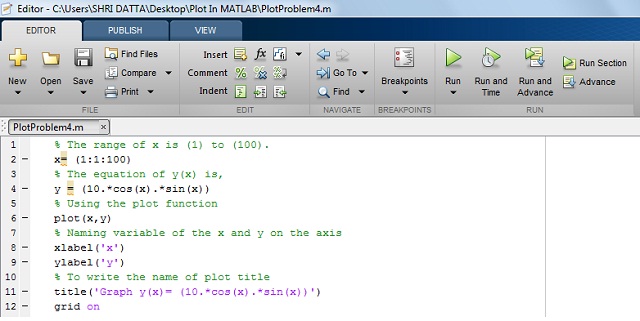
MATLAB code for Trigonometric function:
Write the MATLAB program for the equation of y(x) as below.
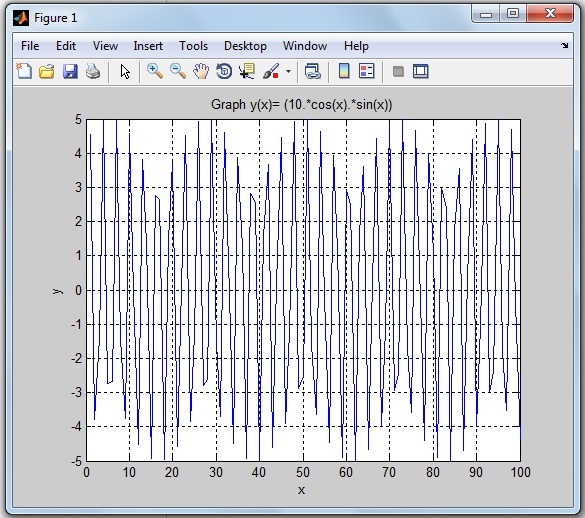
Output in MATLAB:
By running the code, you get the MATLAB graph for corresponding mathematical trgnomtric function.
These mathematical equations are solved with the help of MATLAB code. If you have any query, please write and discuss with me in the comment.
If you find this tutorial to plot MATLAB graph useful, I would like to hear from you in the comment.
My upcoming tutorial, I will be writing about 3Dimentions MATLAB graph plotting. I will share it with you as early as possible.