
How to draw Bar plot in MATLAB?
Syntax:
The syntax for the bar plot is,
bar(x,y)

bar(x,y,'colourmarkerlinespec')
MATLAB Code:
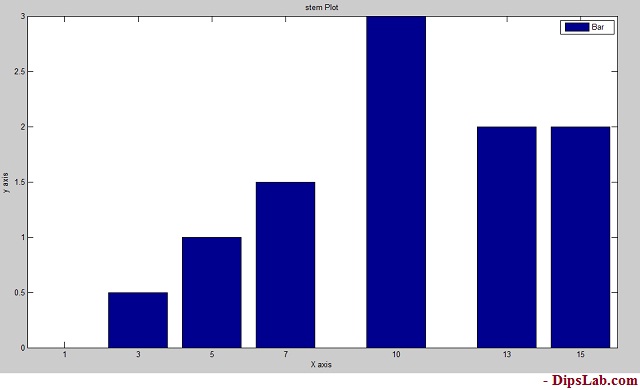
Let’s write a MATLAB code to plot the Bar for arrays of some random numbers.
x=[1 3 5 7 10 13 15];
y=[0 0.5 1 1.5 3 2 2];
bar(x,y)
title('Bar Plot')
xlabel('X axis')
ylabel('y axis')
Output in MATLAB:
Below is diagram as bar 2-dimensional plot.
4. Barh Plot
Barh plot is short abbreviations of Horizontal bar. Here I am using the Barh function for the horizontal plane.