
How to draw a Pie Plot in MATLAB?
Syntax:
pie(x)
MATLAB Code:
To write the simple code for the pie plot.
x=[10 20 25 40 75 80 90];
pie(x)
title('Pie Plot')
We have 7 numbers in the array ‘x’.
When you execute the above code in MATLAB, All the values in array gets converted in the percentage.
Output in MATLAB:
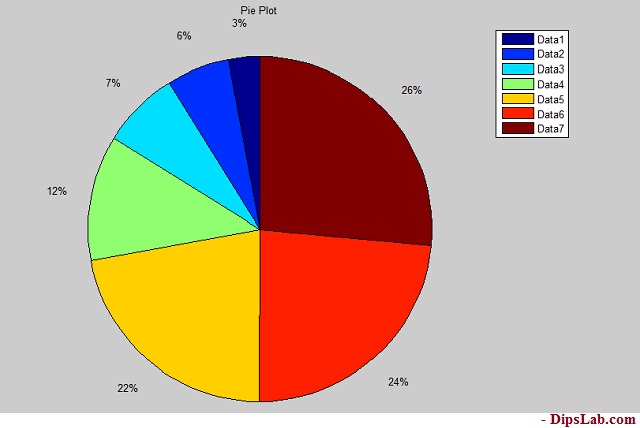
If you look at the code, we have not added any color function. By default, Pie plot is colorful. So it makes plotting Pie graph even easier.
8. Polar Plot
Plotting Polar plot is a little tricky.
When you are plotting the polar plot, theta and radius must be the same size