
How to plot the Polar in MATLAB?
Syntax:
In Polar plot, you can write the following syntax,
polar(theta,radius)
polar(theta,radius,'colourmarkerlinspec')
Polar plot function has arguments as theta, radius, line specification.
MATLAB Code:
theta=[-pi/2 pi 2*pi];
radious=[2 6 9];
polar(theta,radius,'r--')
title('Polar Plot')
Where ‘r’ considered as the red color.
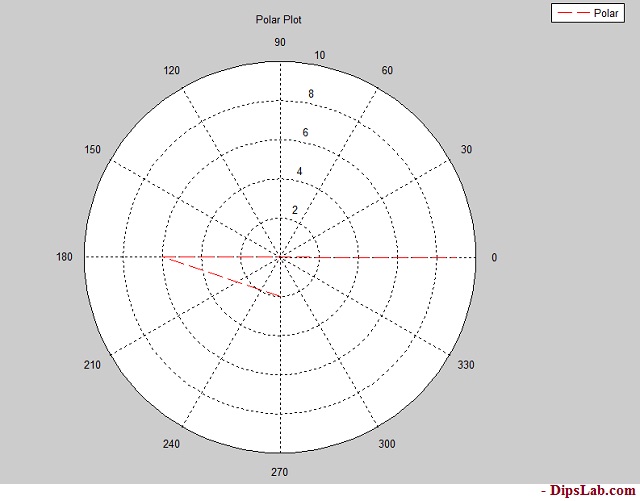
Output in MATLAB:
The line specification and color are shown in the below diagram. Red dashed depicts the given radius of the circle [2 6 9].
9. Compass Plot
Compass plot is the same as the polar plot. Both need equal quantities of theta and radius.
How to draw a Compass Plot in MATLAB?