
How to draw a Compass Plot in MATLAB?
Syntax:
The syntax of the compass plot is,
compass(theta,radius)
compass(theta,radius,'colourmarkerlinespec')
MATLAB Code:
For the designing compass plot, you just need to write only ‘compass’ function.
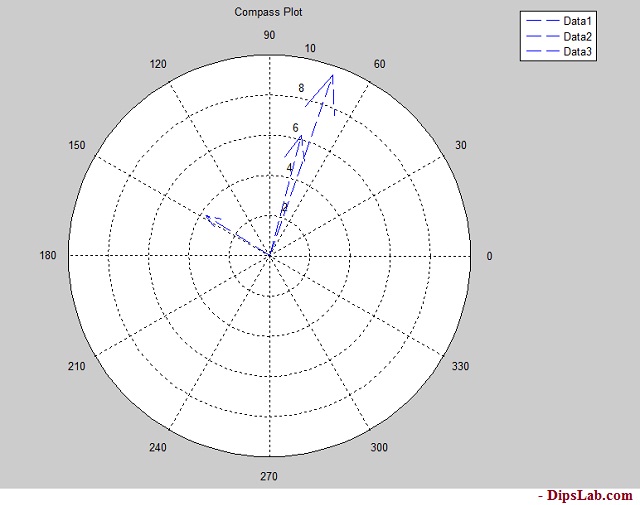
theta=[-pi pi/2 pi];
r=[2 6 9];
compass(theta,r,'b--')
title('Compass Plot')
Output in MATLAB:
10. Scatter Plot
Plotting the scatter plot in MATLAB is simple.