
How to Slice 3D Plot in MATLAB
For plotting slice graph, you must know volumetric data(v), specification of three-dimensional coordinate (x,y,z), and ‘xslice, yslice, zslice’.
Syntax:
Slice plot’s syntax is
slice(x,y,z,v,xslice,yslice,zslice)

slice(v,xslice,yslice,zslice)
Where,
- xslice- ‘x’ coordinate data for slice plot
- yslice- ‘y’ coordinate data for slice plot
- zslice- ‘z’ coordinate data for slice plot
MATLAB Code:
Slice plot is little different from other 3D plots types. When you are writing MATLAB code for Slice plot, you need to specify each coordinator value.
Let’s draw the slite plot graph for an exponential mathematical equation.
[x,y,z] = meshgrid(-10:.2:10);
v = [exp((x.^2)-(y.^3)-(z.^5))];
xslice = 0.1;
yslice = 5;
zslice = 0;
slice(x,y,z,v,xslice,yslice,zslice)
colorbar
title('\bf Slice Plot')
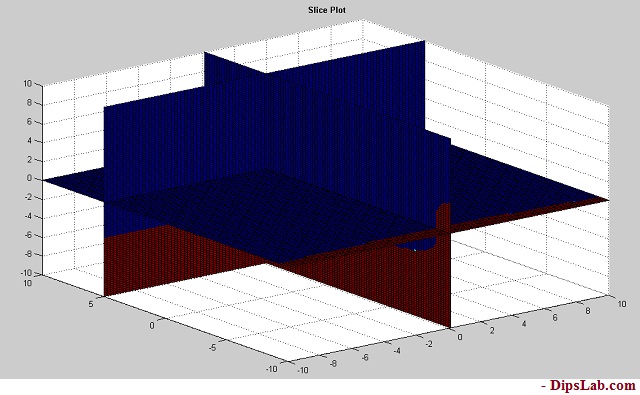
Output in MATLAB:
The output looks like the below picture.
These are the topmost three dimensional [3D] used in the industry projects.
This is all about different MATLAB 3D plot examples. I have explained the different classification of MATLAB 3D plots with simple code and syntax.