
How to create the three dimensional [3D] contour plot?
To create the three dimensional [3D] contour plot, we are using the ‘contour3’ function.
Note: You can plot the Contour 2D plot by using the only ‘contour’ function.
Syntax:
The syntax for the three-dimensional contour plot,
contour3(x,y,z)
contour3(z)
MATLAB Code:
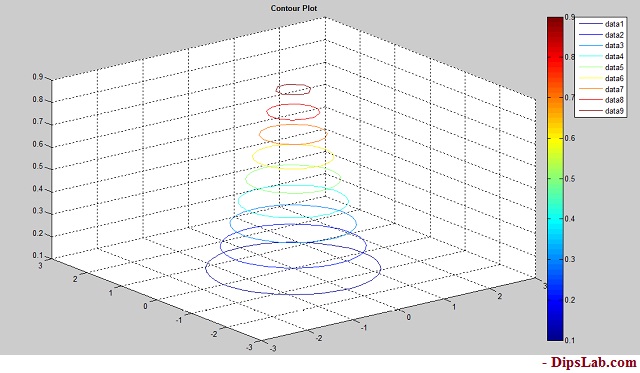
We are plotting the contour plot for the exponential mathematical equation is (exp( x²-y²)).
[x,y] = peaks(30);
z = exp(-x.^2-y.^2);
contour3(x,y,z);
title('\bf Contour Plot')
Output in MATLAB:
Below is a diagram for three dimensional [3D] contour plot.
5. Slice 3D Plot in MATLAB
For plotting slice graph, you must know volumetric data(v), specification of three-dimensional coordinate (x,y,z), and ‘xslice, yslice, zslice’.