
How to draw a Barh Plot in MATLAB?
Syntax:
The same syntax uses like bar plot,
barh(x,y)
barh(x,y,'colourmarkerlinespec')
MATLAB Code:
x=[1 3 5 7 10 13 15];
y=[0 0.5 1 1.5 3 2 2];
barh(x,y)
title('Barh Plot')
xlabel('X axis')
ylabel('y axis')
Output in MATLAB:
Barh plot is showing in the below diagram.
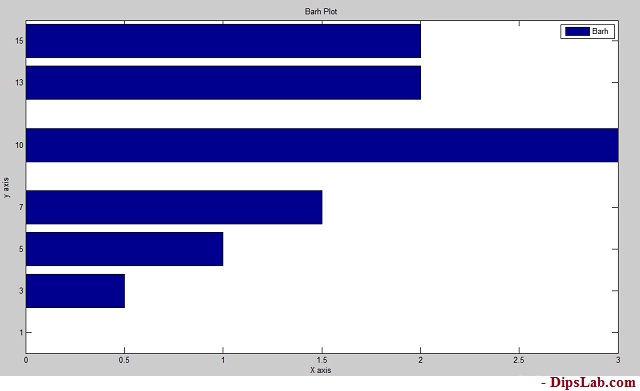
If you look at the above graph, you can see it the exact 90-degree tilt of Bar graph.
5. Errorbar Plot
Errorbar plot is again of the types of bar plot.