
How to draw a Scatter Plot in MATLAB?
Syntax:
For the scatter plot,
scatter(x,y)
scatter(x,y,'colourmarkerlinespec')
MATLAB Code:
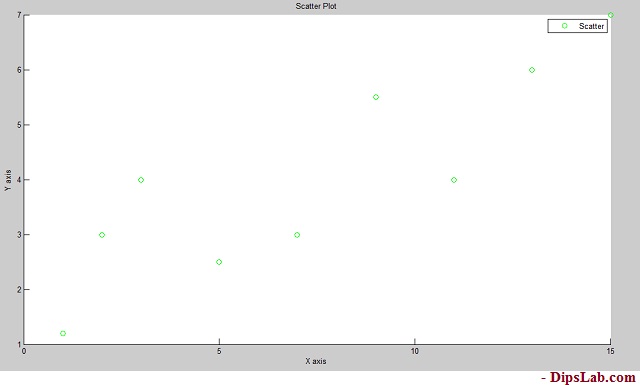
x=[1 2 3 5 7 9 11 13 15];
y=[1.2 3 4 2.5 3 5.5 4 6 7];
scatter(x,y,'g')
title('Scatter Plot')
xlabel('X axis')
ylabel('Y axis')
Output in MATLAB:
After the running MATLAB code, you will see this…
There are so many 2D plots you can draw in MATLAB. I described briefly the most useful top 10 plots.