How to draw an Errorbar Plot in MATLAB?
Syntax:
The syntax for the Errorbar plot are,
errorbar(x,y)
errorbar(x,y,'colour')
errorbar(x,y','marker')
errorbar(x,y,'linespec')
MATLAB Code:
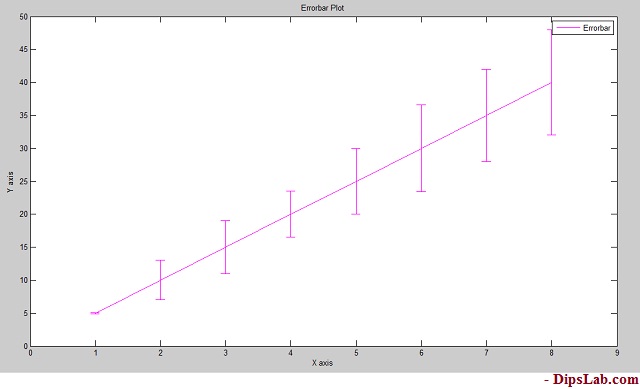
x=[5 10 15 20 25 30 35 40];
y=[0.1 3 4 3.5 5 6.6 7 8];
errorbar(x,y,'m')
title('Errorbar Plot')
xlabel('X axis')
ylabel('Y axis')
We are adding color function to decorate our plot.
Output in MATLAB:
See the 2-dimensional error plot.