
How to plot Sin Wave Model using MATLAB Simulink
In this example, we will draw a simple sin wave model in MATLAB Simulink. And then we will see to run MATLAB Simulink model for sin wave.
In the following image, you can see, a single sin wave (source) is connected to the scope (sink) by a straight arrow line.

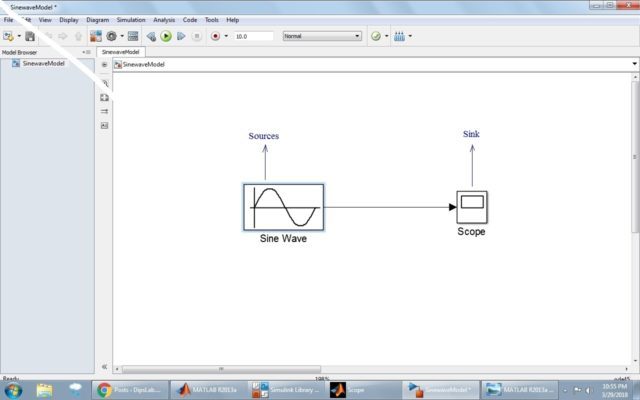
Figure 1: Input of Sin wave
When you double-click on the source, you can see the source block parameter. This helps to select several choices related to the terms.
The changing of the parameter also changes its output result.
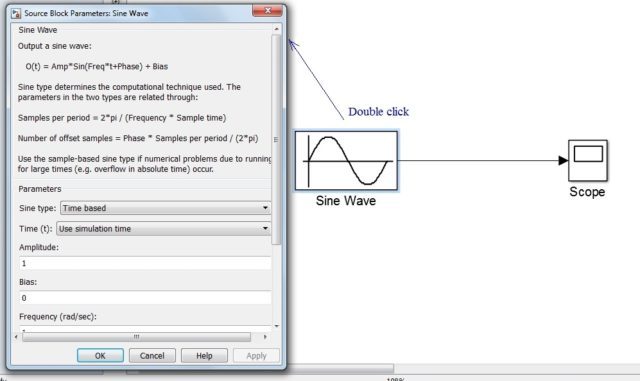

Figure 2: Parameter of source
Scope or sink represents the output result in the form of the wave.
When you select the setting option, you can set the different function like as General, History, Style for result or output.
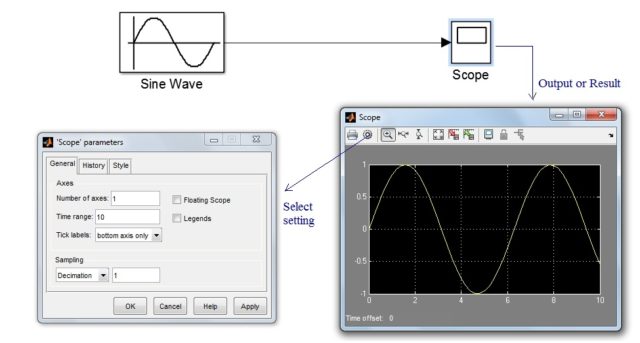
Figure 3: Output of Sin wave
Finally, we got the output of sin wave with the peak value of amplitude and periodic time ‘t’.
These are some proper steps to run MATLAB Simulink model. I know you may still some doubt as you are new to the MATLAB. Feel free to ask any doubt in the comment. I will reply you back