
Part 3: MATLAB Code Initialization and ECG Data Collection
Part 3: MATLAB Code Initialization and ECG Data Collection
arduinoObj = serialport("COM11", 9600);
configureTerminator(arduinoObj, "CR/LF");
numSamples = 1000;
ecgData = zeros(1, numSamples);
disp('Collecting ECG data...');
for i = 1:num
Samples data = readline(arduinoObj);
numericData = str2double(data);
if isnan(numericData) || isinf(numericData)
numericData = 0;
end
ecgData(i) = numericData;
end
This MATLAB code establishes a serial connection to an Arduino on COM11 at 9600 baud. It prepares to collect 1,000 ECG samples by reading data from the Arduino. Each sample is converted to a numeric value, replacing any non-numeric or infinite readings with zero, and stored in an array.
Signal Processing
samplingRate = 250;
ecgDataScaled = (ecgData - min(ecgData)) / (max(ecgData) - min(ecgData));
windowSize = 10;
ecgDataSmoothed = movmean(ecgDataScaled, windowSize);
[b, a] = butter(2, 0.5/(numSamples/2), 'high');
if all(isfinite(ecgDataSmoothed))
ecgDataFiltered = filtfilt(b, a, ecgDataSmoothed);
else
error('Signal contains non-finite values.');
end
This MATLAB code processes ECG data by first normalizing it to a range of 0 to 1 using min-max scaling. The samplingRate is set to 250 Hz, and a moving average with a window size of 10 is applied to smooth the scaled ECG data, reducing noise. A high-pass Butterworth filter is designed with a second-order polynomial and a cutoff frequency of 0.5 Hz, calculated based on the number of samples. The code checks if all smoothed ECG data points are finite. If they are, it applies the filter using filtfilt, which performs zero-phase filtering. Otherwise, it raises an error for non-finite values.
Feature Extraction
minPeakHeight = 0.15;
minPeakDistance = 50;
[peaks, locs] = findpeaks(ecgDataFiltered, 'MinPeakHeight', minPeakHeight, 'MinPeakDistance', minPeakDistance);
scalingFactor = 1;
rAmplitudes = peaks * scalingFactor;
averageRAmplitude = mean(rAmplitudes);
if length(locs) > 1
rrIntervals = diff(locs);
rrIntervalsSec = rrIntervals / samplingRate;
averageRRIntervalSec = mean(rrIntervalsSec); rrIntervalSpeedMs = (averageRAmplitude / averageRRIntervalSec);
pulseRate = 60 / averageRRIntervalSec;
else rrIntervalSpeedMs = NaN;
pulseRate = NaN;
end
This MATLAB code detects peaks in filtered ECG data using the findpeaks function with parameters for minimum peak height of 0.15 and minimum peak distance of 50 samples. It calculates the R-wave amplitudes and their average. If multiple peaks are detected, it computes RR intervals in seconds, the average RR interval, and pulse rate; otherwise, it assigns NaN to these values.
Prediction
age = 20;
gender = categorical({'M'});
features = table( averageRAmplitude,averageRRIntervalSec,rrIntervalSpeedMs, age, gender, 'VariableNames', {'Amplitude', 'RR', 'Speed', 'Age', 'Gender'}); load('ClassificationLearnerSession.mat');
[predictions, scores] = trainedModel.predictFcn(features); disp('Predictions:');
disp(predictions);
disp('Scores:');
disp(scores);
This MATLAB code creates a table of features for prediction, including average R-wave amplitude, average RR interval, RR interval speed, age, and gender. It then loads a pre-trained classification model from a file, uses the model to predict outcomes based on the features, and displays the predictions and associated scores.
Serial Communication
predictionText = char(predictions);
writeline(arduinoObj, predictionText);
pulseRateStr = num2str(pulseRate);
writeline(arduinoObj, pulseRateStr);
This MATLAB code converts predictions to text and sends them to the Arduino, along with the pulse rate as a string.
ECG Waveform Plot
figure;
subplot(3,1,1);
plot(ecgDataScaled);
title('Raw ECG Waveform');
xlabel('Time (samples)');
ylabel('ECG Signal');
grid on;
subplot(3,1,2);
plot(ecgDataSmoothed);
title('Smoothed ECG Waveform');
xlabel('Time (samples)');
ylabel('ECG Signal');
grid on;
subplot(3,1,3);
plot(ecgDataFiltered);
hold on;
plot(locs, peaks, 'r*', 'MarkerSize', 8);
title('Filtered ECG Waveform with Detected R-peaks');
xlabel('Time (samples)');
ylabel('ECG Signal');
grid on;
for i = 1:length(locs)
line([locs(i) locs(i)], ylim, 'Color', 'r', 'LineStyle', '--', 'LineWidth', 0.5);
end
figure;
bar(scores);
title('Prediction Scores');
xlabel('Classes');
ylabel('Scores');
xticklabels({'Bradycardia', 'Normal', 'Tachycardia', 'Ventricular Tachycardia'});
xtickangle(45);
This MATLAB code generates two figures. The first figure displays three subplots: the raw ECG waveform, the smoothed ECG waveform, and the filtered ECG waveform with detected R-peaks marked in red. The second figure is a bar chart showing prediction scores for different disease classes.
3D Design
The 3D model is created in SolidWorks platform. It consists of main box with display which is used to display real time results. The dot board is placed inside the box. The ECG electrodes are connected to the box. The wearable structure wristband is attached with the max30102 sensor and it is connected to the box.

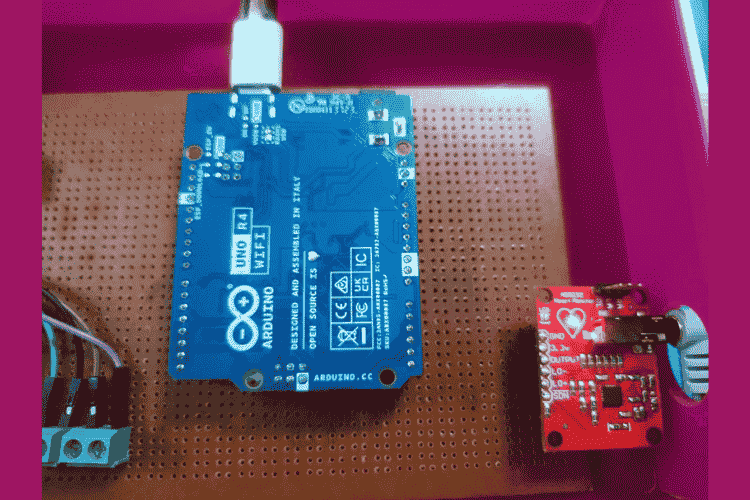
Hardware Setup

The Arduino UNO R4 WIFI microcontroller is connected with MAX30102 sensor, OLED display and AD8232 ECG module in dot board using connectors. Then the ECG module is connected with the three electrodes.


Result

The first plot displays the original ECG waveform with noise and baseline wander artifacts. The second plot displays the smoothened ECG signal which reduces the noise and artifacts. The third plot displays the filtered ECG signal with the detected R peaks marked by red asterisks and vertical dashed lines. R peaks are identified by locating the highest points in each heartbeat cycle. The SNR ratios are 14.5 dB for the raw ECG waveform, 19.2 dB for the smoothened ECG waveform and 22.5 dB for the filtered ECG waveform.

The OLED displays the result of the four classes. In normal the ECG wave is collected from the user and features are extracted. The extracted features are compared with the trained model and SpO2 value is calculated from the MAX30102 sensor. The heart rate is calculated from the RR interval of each heartbeat cycle. To test the other conditions such as tachycardia, bradycardia and ventricular tachycardia, we have replaced the variables like amplitude, RR interval and speed with the testing data variables.

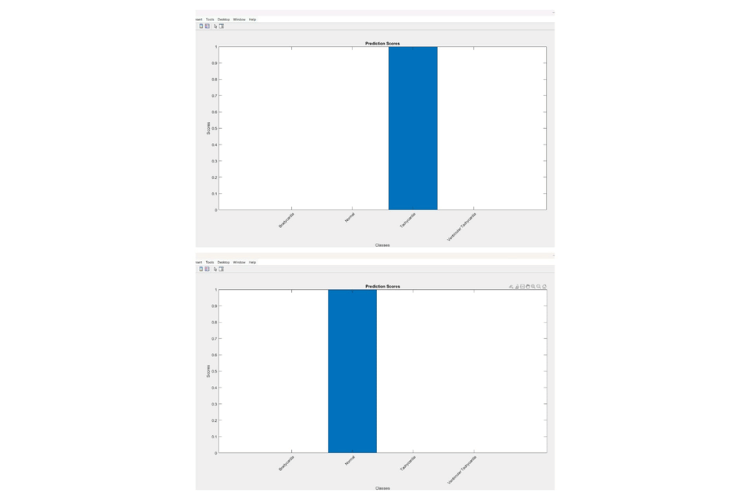
This is the prediction scores of the four classes Bradycardia, Tachycardia, ventricular tachycardia and normal.