
Problem 3: How to plot the Exponential Function in MATLAB?
Let’s take an example of a trigonometric and exponential function.
The function of y(x)= (3sin(x)e^-0.4x)

for 0<x<20
Solution:
In this problem, this equation has trigonometric and exponential functions.
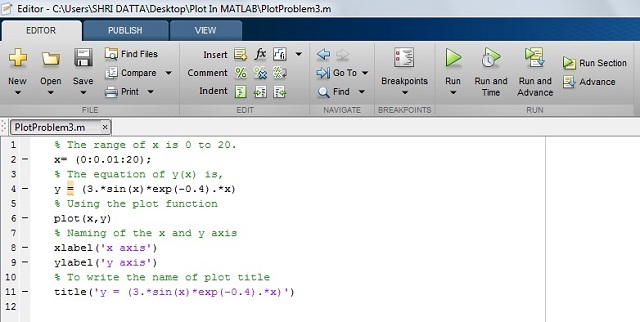
MATLAB code for Exponential function:
Here is code the function y(x) in MATLAB.
Output in MATLAB:
The exponential wave is getting generated after the running MATLAB program as shown in the below figure.
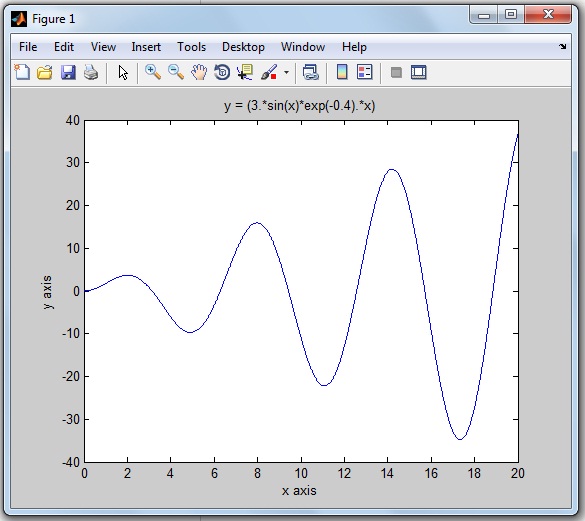
The above exponential figure is drawn without the function of the grid (i.e. grid off function)